Tracing a Solution to Enterprise Data Problems

Get the latest in your inbox
Get the latest in your inbox
It is important to be able to not only discover connections but explain them to your stakeholders. The ability to identify all links between seemingly unrelated data is called traceability.
If you think about your daily work, it’s no surprise why this would be useful. How many colleagues do you collaborate with? How many projects are you working on? How many customers are these projects connected to? How many supplier contracts? Across the enterprise, work is a web of interconnections.
Yet, more often than not, these interconnections are not easy to see or analyze as a result of work, and therefore data storage, done in silos. This makes it difficult to do things like harmonize data, follow your nose when you come across something interesting, identify dependencies, and find the source of a problem. For each of these use cases, you need to be able to chart a path from one data point to another, or one point in time to another, or one external party to another.
A problem that results from disconnectedness needs a solution that’s based in connection. Graph at its very core is about the relationships between data. It represents data as nodes and edges, rather than the rows and columns most of us are familiar with in traditional databases. This model is more expressive, meaning you can see more of the detail and nuance of how data points are connected together. This makes it the perfect solution for exploring the connections between data.
Below are several examples — across manufacturing, life sciences, and financial services — of how Stardog customers are achieving traceability and to power business critical, and in one instance life-saving, use cases.
NASA uses Pelorus, a data navigation tool based on Stardog, to support its Artemis mission to return astronauts to the moon and eventually send them to Mars.
To successfully and safely send astronauts into orbit, NASA analysts need to evaluate a complex set of data that prevents or reacts to hazardous events. Minor technical changes to an aircraft can cause a rippling effect across operational controls, pilot training, certification of flight readiness, and ultimately the safety of pilots and passengers onboard. Traditional means of capturing this information and performing analysis required manual extraction of data across numerous silos, manual identification of key relationships in this data, and then large reviews and analyses to assign appropriate controls to hazards. Not integrating all this data properly could result in very real disaster similar to the Columbia space shuttle.
With Pelorus, NASA is able to get full traceability across the mission, from verifications put in place to ensure compliance with program requirements, all the way through to launch procedures. For example, a requirement such as “humans must be able to tolerate the vibrations of the rocket,” must link to a Hazard Record that specifies, “if you shake astronauts too much, they may become unconscious or critically injured” in a vibration calibration model. Analysts can now do this type of harmonization in minutes, rather than weeks, and they can do so for similar sorts of interdependencies across 36 different data types.
Read more about how Stardog is making traceability possible at NASA in our case study.
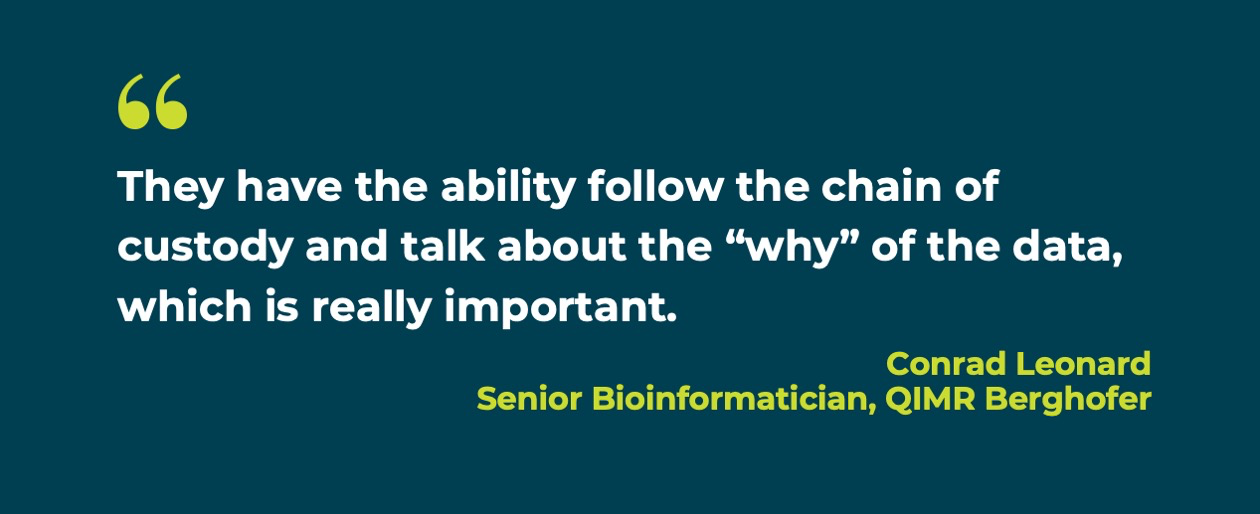
QIMR Berghofer, a leading medical research institute, transitioned their Laboratory Information Management Systems (LIMS) from a relational database to Stardog. They’re now able to drill deep into their data and can follow the path from sample, to sequencing library made from that sample, to sequence made on that library, and onward to the next stage of analysis.
Before, writing a report or finding a piece of information from their relational systems quickly became a nightmare. Once more than four or five tables were involved, the technical requirements to join all the data together were very complex. With a graph-based approach, they now have the ability to explore the depth of data in an ad hoc fashion, meaning when they discover something interesting, they can easily dig into the details.
The FAIR data principles are one of the most important concepts in life sciences data management today. In addition to providing traceability, knowledge graphs are also the ideal solution to fulfill the FAIR data principles. For pharmaceutical companies to understand the root cause of adverse effects, they need to be able to associate complex product hierarchies between molecule, drug trial name, and finished product.
Learn more about about how Stardog is enabling traceability in life sciences here.
One Stardog financial services customer, a global bank with nearly $900 billion in total assets relies upon traceability in their operational risk practice. When a risk event occurs, analysts need to analyze 25,000 controls—safeguards put in place to mitigate risk events—and then figure out which control needs to be modified to prevent a similar risk event in the future. These controls exist across a dozen or more systems. Previously, risk response required ad hoc analysis of each individual system. This was not only time-consuming, but it also means analysts could not be sure they’d incorporated all the data relevant to a particular incident.
The underlying problem was that the way the data systems are structured did not reflect the networked way in which policies and assets within the bank interact. One employee or one external, malicious actor interacting with one laptop or one bank account triggers a control in one system. In reality, however, all these various actors, assets, controls, and systems are interconnected.
This bank used Stardog to identify relationships across the various applications involved in risk management, including incident reporting, control registries, and IT asset management systems. Analysts now traverse the linked information to uncover dependencies within the data and identify root causes of particular incidents.
Learn more about using traceability to build operational resilience by watching this webinar.
The key factor in managing risk is transparency. This is especially true when it comes to supply chain.
Just a few years ago, Ford Motor Company was hit by parts unavailability due to a plant fire. The question is: was Ford aware of the sole source risk and failed to manage it properly, or was it not aware of the risk at all? Supply chains based on traditional, relational approaches are incredibly hard to see into, and in many cases it is the latter.
New regulatory requirements also are increasing the need for traceability across the supply chain. The EU recently instituted regulations which require medical device manufacturers to invest in technologies that make it possible to trace their products in the event of a safety recall. As part of the regulation, manufacturers are now expected to manage the entire lifecycle of their products and update regulators via surveillance reports and periodic safety updates.
With a knowledge graph, supply chain companies can build a data fabric—a digital representation of their business that mirrors the real-world complexities of how their organization operates. Thanks to the connected nature of graph, it is easy to dive into these relationships and uncover, say, the origin of a product or a point of failure.
You can read about how Ericsson built a digital supply network using Stardog here.
All of these use cases are made possible by graph and the new way it allows you to connect data within your organization. This level of traceability is very difficult to achieve with a relational system. With graph, traceability is an inherent capability, and moreover, it makes it easy to edit, change, and adapt data to reuse it for a different purpose.
Interested to learn more about how graph works? Start here.
The way to fill the gap between where most organizations’ data systems are today and operational resilience is a broad, reusable data layer that unifies information and identifies relationships between various assets.
Ericsson combines their expertise in communications technology and network design with a Stardog knowledge graph to create the Connected Logistics Chain, a new global shipping platform.
How to Overcome a Major Enterprise Liability and Unleash Massive Potential
Download for free